1. In a nutshell
- Developed in 1986 by Richard Stallman at MIT.
- Current official maintainers come from RedHat, AdaCore, and Google.
- Significant contribution from the open source community.
2. Brief Technical Details
- Allows programmers to see inside and interact/modify with all components of a programs, including information inside the registers.
- Allows programmers to walk through the program step by step, including down to instruction level, to debug the program.
3. Cheatsheet
- Study this cheatsheet
- Developed by Dr. Doeppner at Brown University.
- Become very comfortable with terminal!
- We will work on the terminal extensively here, say goodbye to VSCode. You can certainly use VSCode, but you will miss out on a fine tool!
4. tmux
- Our workspace is limited within the scope of a single terminal (a single shell) to interact with the operating system.
tmux: terminal multiplexer.tmuxallows user to open multiple terminals and organize split-views (panes) within these terminals within a single original terminal.- We can run/keep track off multiple programs within a single terminal.
5. tmux quickstart 1: multiple sessions
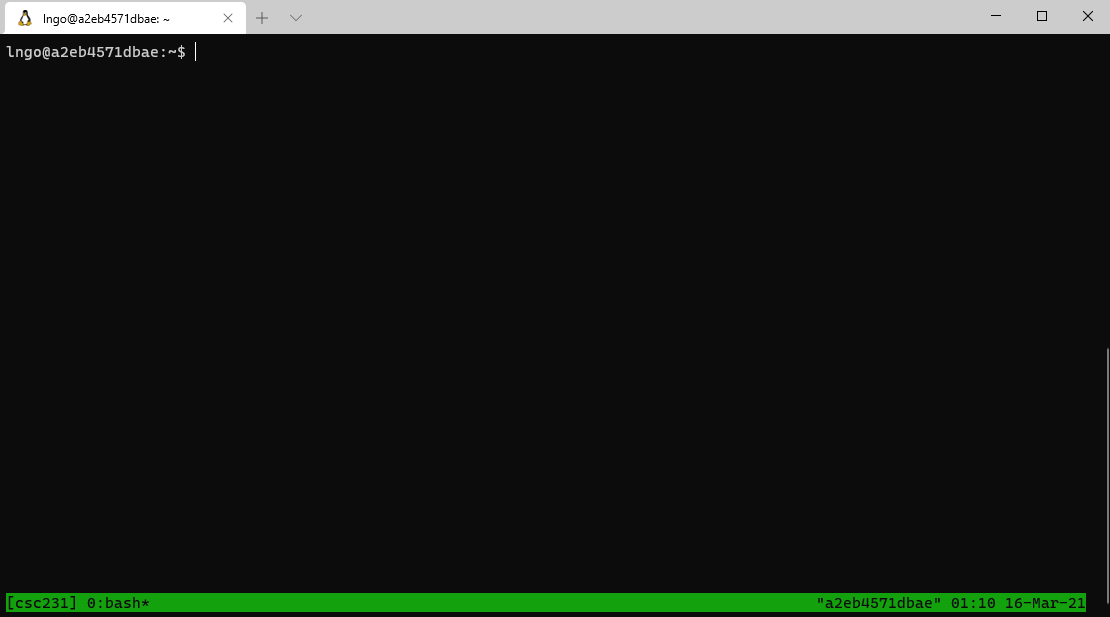
- Open a terminal (Windows Terminal or Mac Terminal).
- Reminder: It is
podmanon Windows anddockeron Mac. Everything else is the same!.- Launch the container:
Windows:
$ podman run --rm --userns keep-id --cap-add=SYS_PTRACE --security-opt seccomp=unconfined -it -v /mnt/c/csc231:/home/$USER/csc231:Z localhost/csc-container /bin/bashMac:
$ docker run --rm --userns=host --cap-add=SYS_PTRACE --security-opt seccomp=unconfined -it -v /Users/$USER/csc231:/home/$USER/csc231:Z csc-container /bin/bash
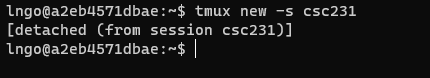
- Start new with a session name:
$ tmux new -s csc231
- You are now in the new tmux session.
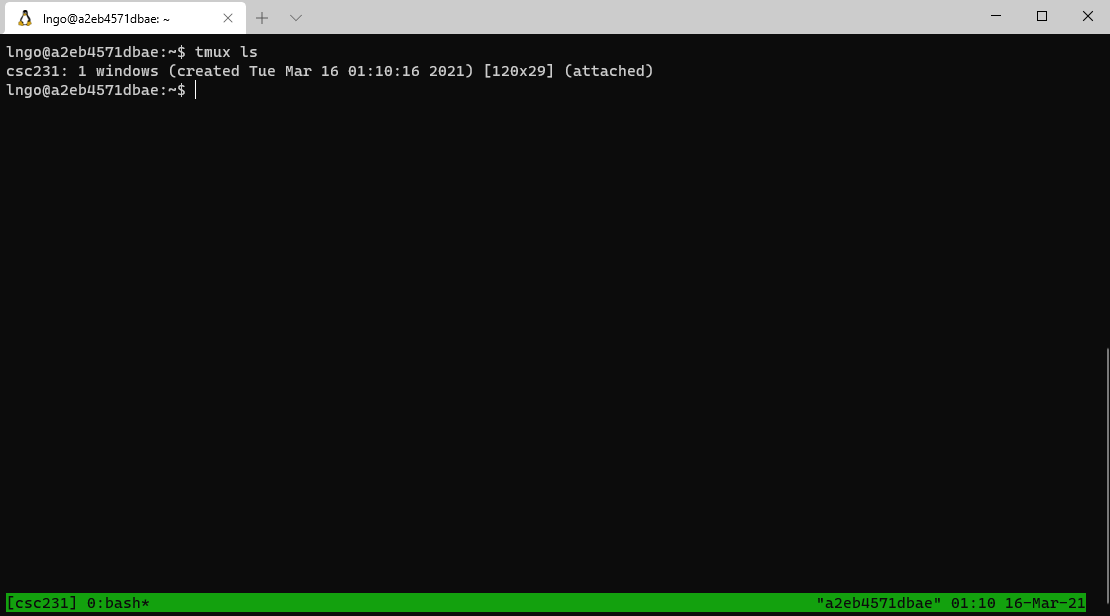
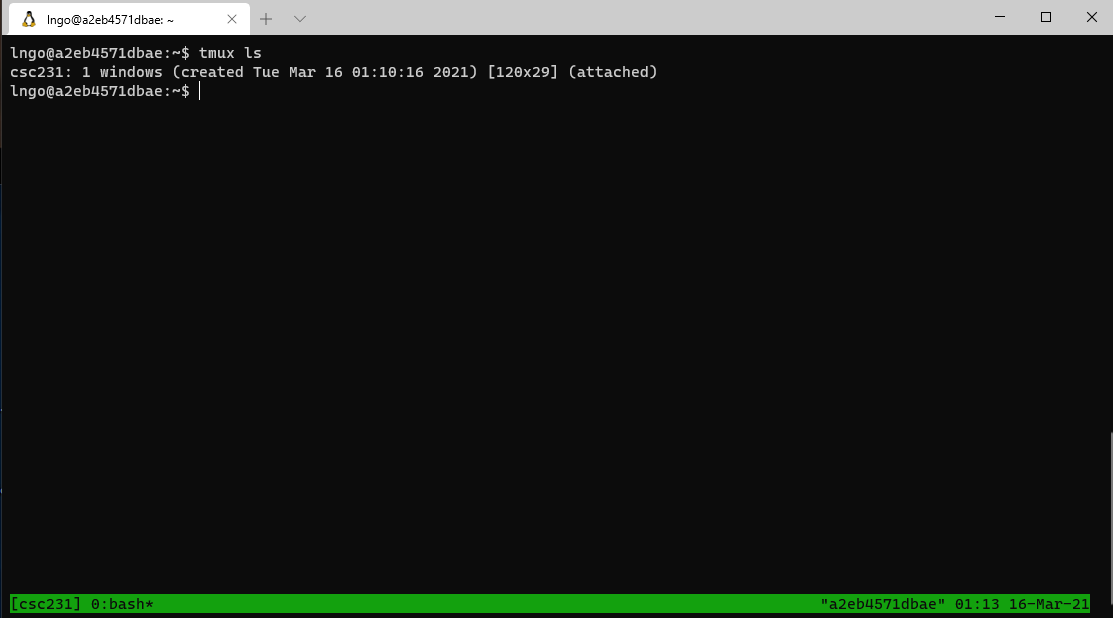
- You can list all active tmux sessions.
$ tmux ls
- Notation: Key press combinations connected with a single dash (
-) means to be pressed together, otherwise, it means lift your finger, then press ….- To go back to the main terminal, press
Ctrl-b, then pressd.
- To go back into the
csc231session:tmux attach-session -t csc231.
- To kill a session:
- From inside the session:
exit, or- From outside the session:
tmux kill-session -t csc231
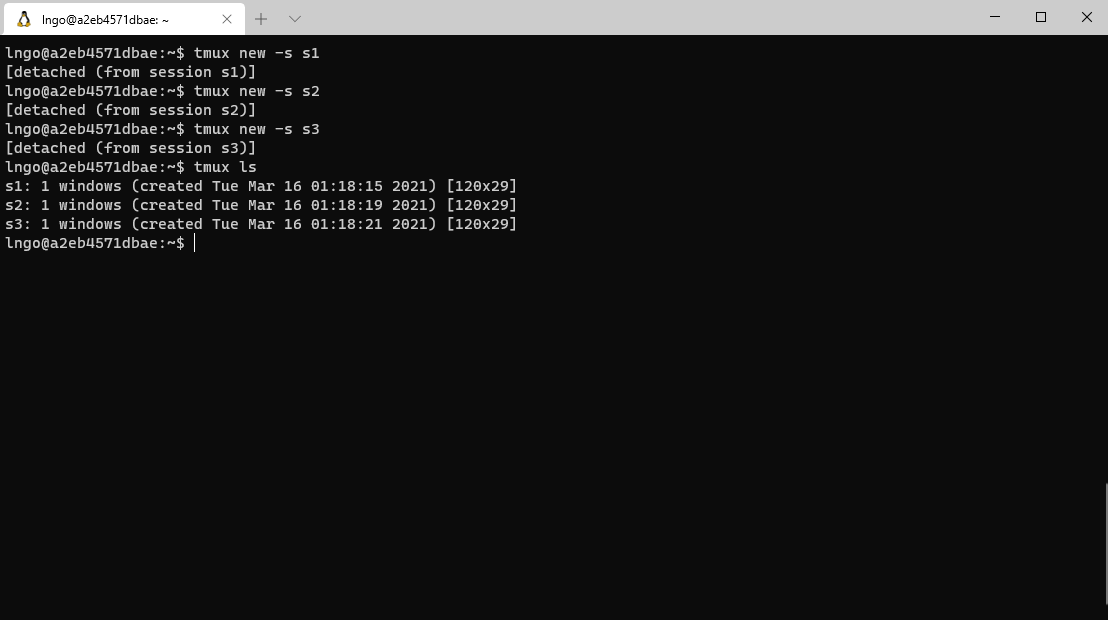
6. Hands on: navigating among multiple tmux sessions
- Run
tmux lsto check andtmux kill-sessionto clean up all existing tmux sessions.- Create a new session called
s1.- Detach from
s1and go back to the main terminal.- Create a second session called
s2.- Detach from
s2, go back to the main terminal, and create a third session calleds3.- Use
tmux lsto view the list of tmux sessions.- Navigate back and forth between the three sessions several times.
- Kill all three sessions using only
exit!
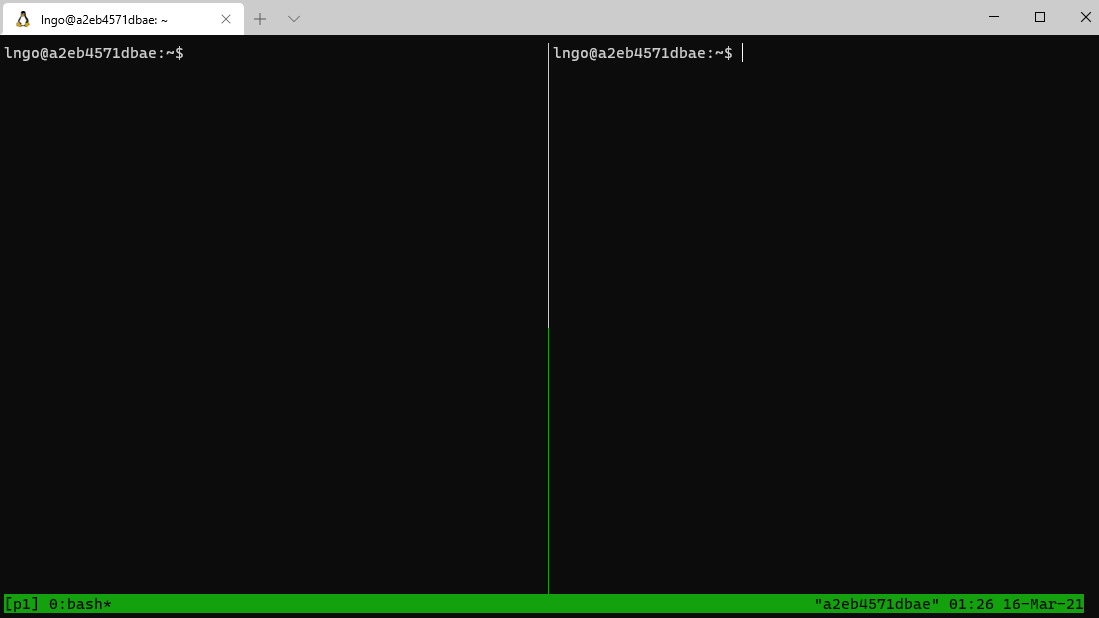
7. tmux quickstart 2: multiple panes
- Create a new session called
p1.- Splits terminal into vertical panels:
Ctrl-bthenShift-5(technical documents often write this asCtrl-band%).
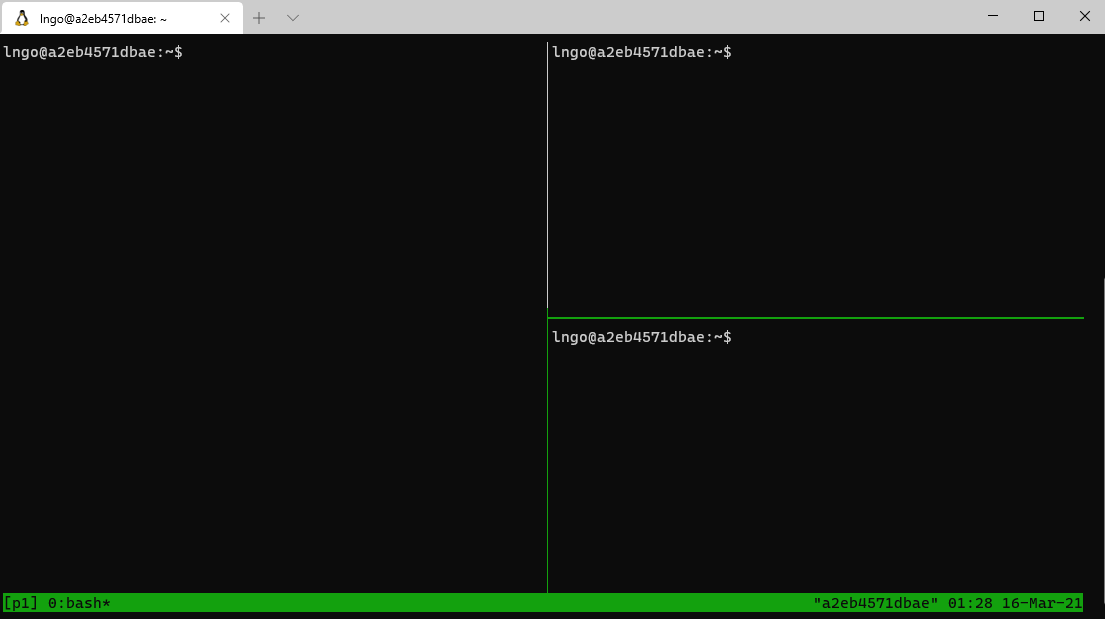
- Splits terminal (the current pane) into horizontal panels:
Ctrl-bthenShift-'( technical documents often write this asCtrl-band").
- Toggle between panels:
Ctrl-bthenSpace.- To move from one panel to other directionally:
Ctrl-bthen the corresponding arrow key.- Typing
exitwill close the pane with the activate cursor.- Run
exitmultiple times to completely close out thep1session. Pay attention to not get out of the container.
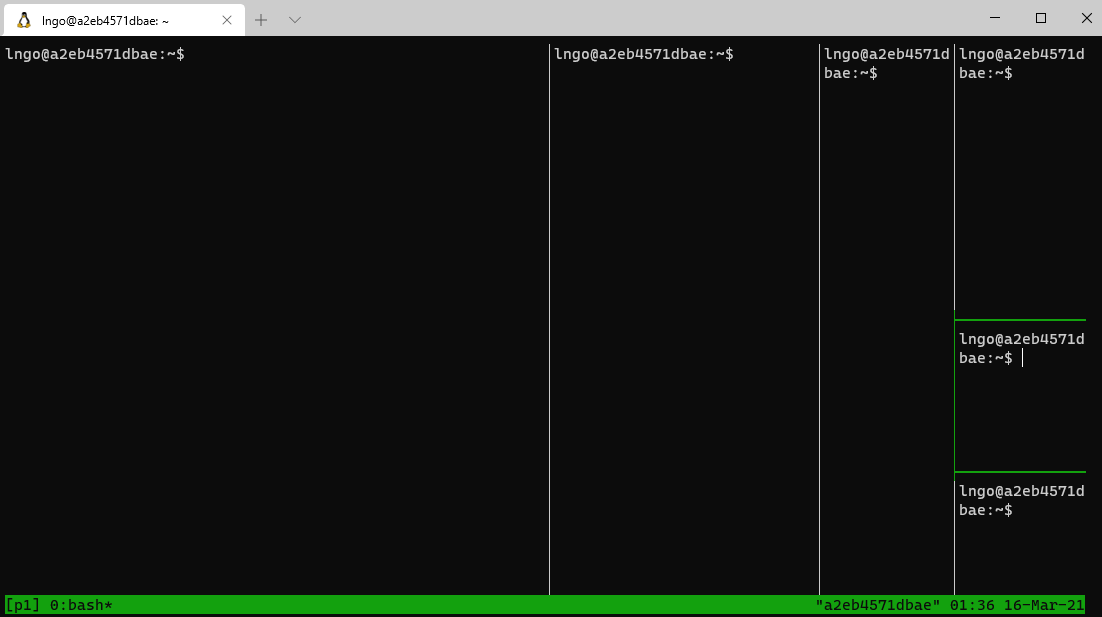
8. Hands on: creating multiple panes
- Run
tmux lsto check andtmux kill-sessionto clean up all existing tmux sessions.- Create a new session called
p1.- Organize
p1such that:
p1has four vertical panes.- The last vertical pane of
p1has three internal horizontal panes.- Kill all panes using
exit!
9. tmux quickstart 3: resizing
- What we did in Hands-on 8 was not quite usable.
- We need to be able to adjust the panes to the proper sizes.
- This can be done by issuing additional commands via tmux’s command line terminal.
- Run
tmux lsto check andtmux kill-sessionto clean up all existing tmux sessions.- Create a new session called
p1.- Split the session horizontally.
- You can adjust the size of two adjacent horizontal panes by press and hold
Ctrl-bthen the left/right arrows.- You can adjust the size of two adjacent vertical panes by press and hold
Ctrl-bthen the up/down arrows.
10. Challenge
Redo the hands-on activity of slide 8 so that all the panes are aesthetically proportional.
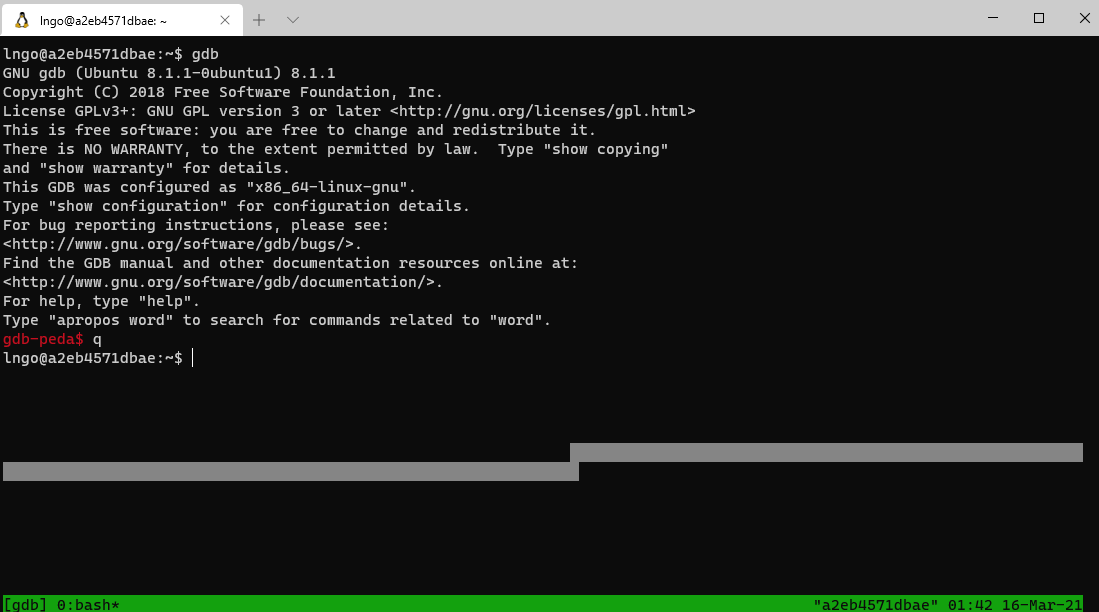
11. Running and exiting gdb
- Create a new session tmux called
gdb.- Run the following command in the
gdbsession.$ gdb
- To exit from gdb type
qand hitEnter.
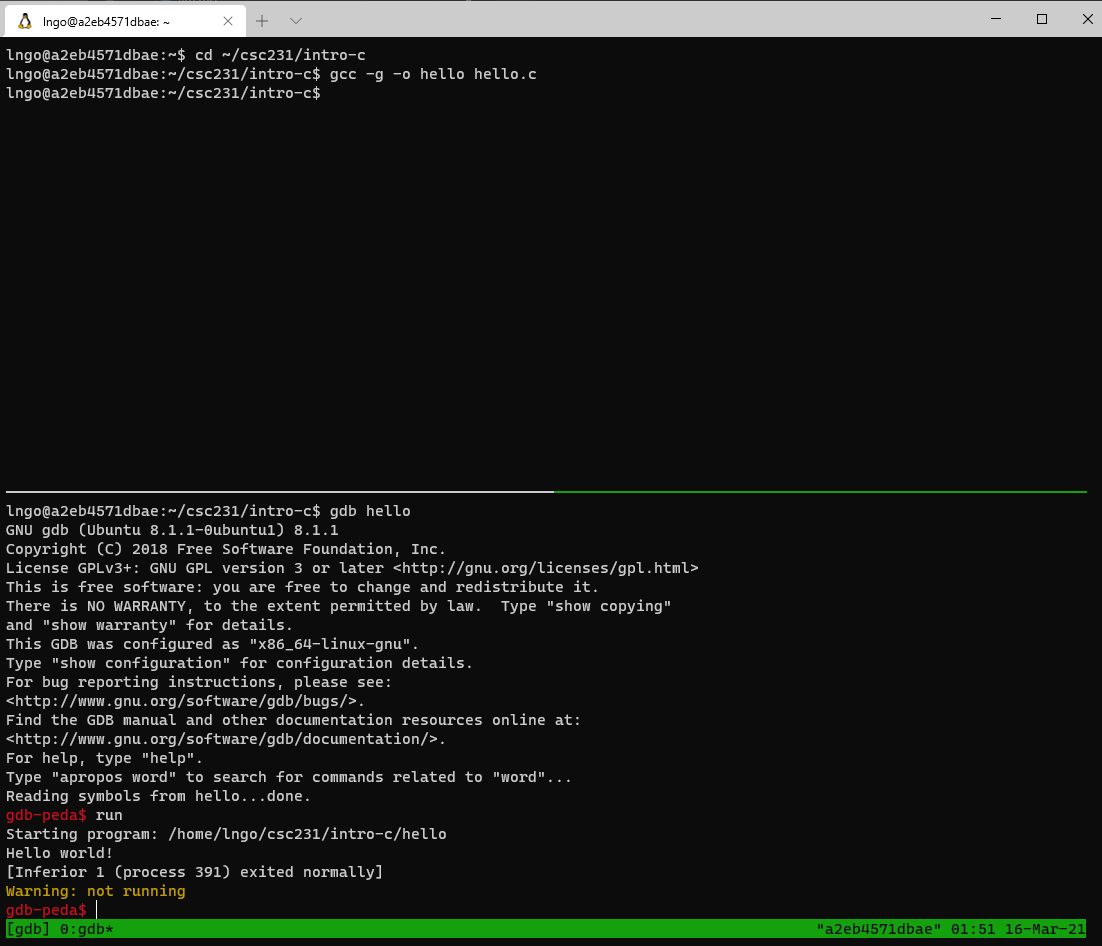
12. Setup an application with gdb
- To use
gdbto debug, we need to compile the program with a-gflag.- Split the
gdbsession into two horizontal panes.- In the top pane, run the followings command:
$ cd ~/csc231/intro-c
$ gcc -g -o hello hello.c
- In the bottom pane, run the followings command:
$ cd ~/intro-c
$ gdb hello
gdb-peda$ run
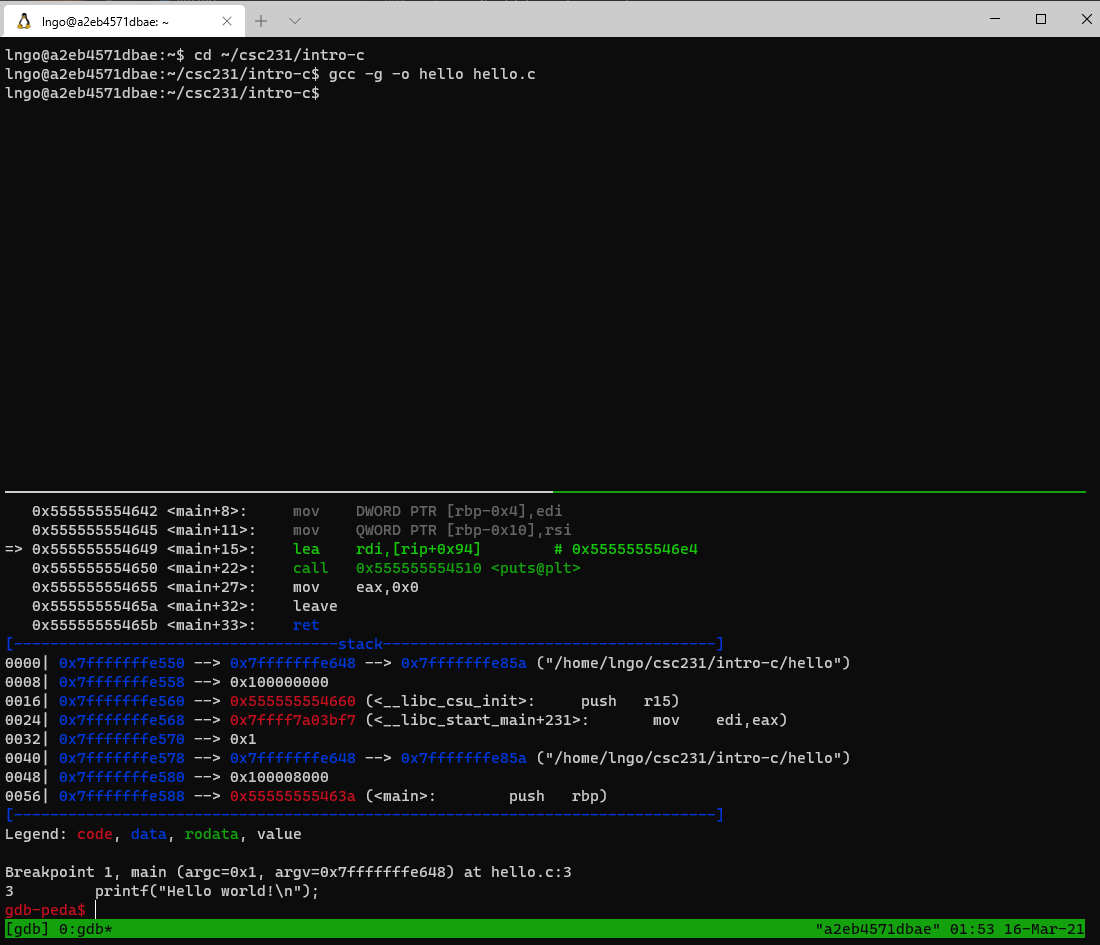
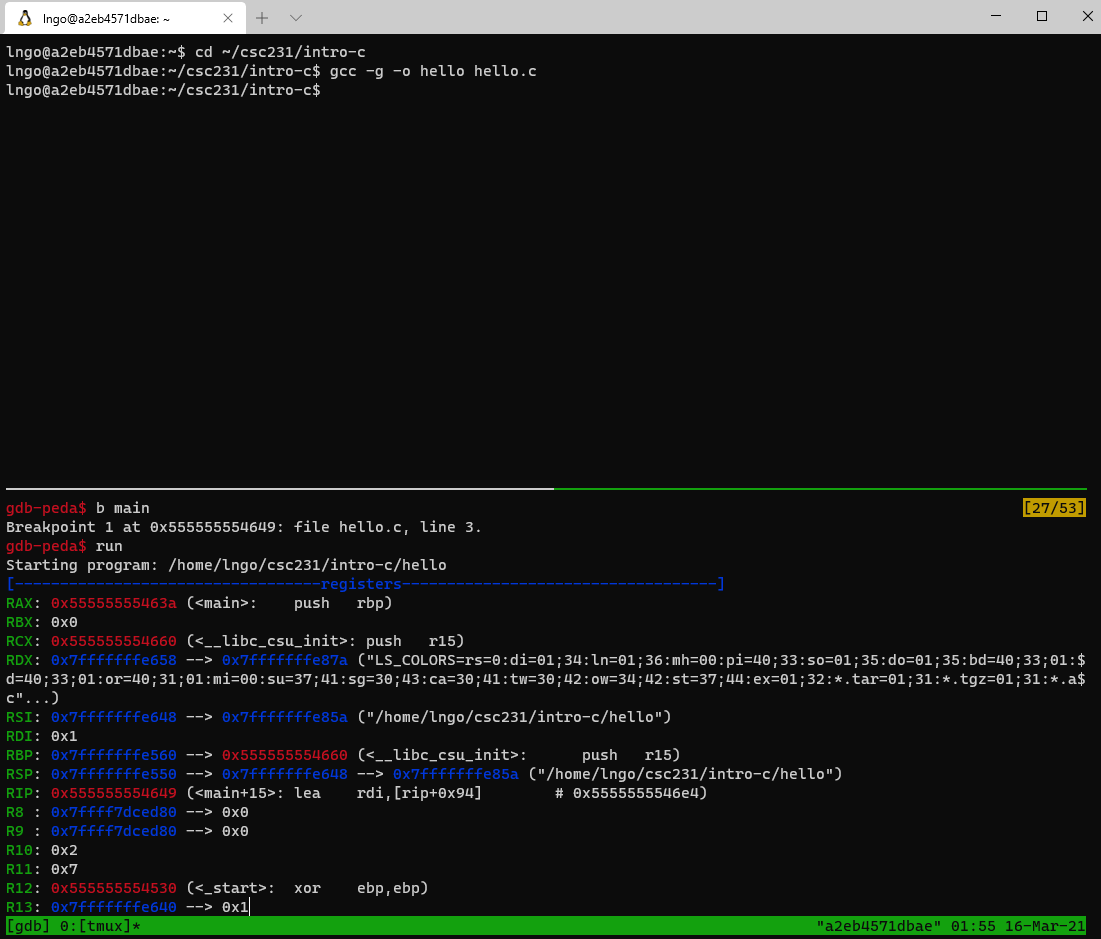
13. Debugging with gdb
- We need to set a
breakpoint:
- Could be a line number or
- Could be a function name
gdb-peda$ b main
gdb-peda$ run
15. Scrolling within tmux’s panes
- Mouse scrolling does not work with tmux.
- To enable scrolling mode in tmux, type
Ctr-bthen[.- You can use the
Up/Down/PgUp/PgDnkeys to navigate.- To quit scrolling mode, type
qorEsc.
- At a glance
- Registers’ contents
- Code
- Stack contents
- Assembly codes
gdbstops at our breakpoint, just before functionmain.- The last line (before the
gdb-peda$prompt) indicates the next line of code to be executed.
16. Hands on: finish running hello
- Type
qorEscto quit scrolling mode.- To continue executing the next line of code, type
nthenEnter.- Turn back into the scrolling mode and scroll back up to observe what happens after typing
n.- What is the next line of code to be executed?
- Type
nthree more times to observe the line of codes being executed and the final warning fromgdb.- Type
qto exit fromgdb.
17. Examining contents of program while debugging
- In the top pane, compile
malloc-1.cin debugging mode.- In the bottom pane, quit the current gdb session and rerun it on the recently created
malloc-1executable.- Setup
mainas thebreakpointand start running.gdb-peda$ b main gdb-peda$ run
- Type
nandEnterto run the next line of code:void *p = malloc(4);- Type
p p: the firstpis short forpis the void pointer variablepin the program.- Try running
p *p. What does that feedback mean?- Type
nandEnterto run the next line of code:int *ip = (int *)p;- Type
p ip: what is the printed value?- Type
nandEnterto run the next line of code:*ip = 98765;- Type
p ip: what is the printed value?- Type
p *ip: what is the printed value?- Type
p /t *ip: what type of data is value? what is the corresponding value in decimal?- Keep hitting
nuntil you finish stepping through all the remain lines of code.
18. Examining contents of program while debugging
- In the top pane, compile
array-4.cin debugging mode.- In the bottom pane, quit the current gdb session and rerun it on the recently created
array-4executable as follows:$ gdb array_4 gdb-peda$ b main gdb-peda$ run
- The next line of code to be run is
size = atoi(argv[1]);- Run the following commands and observe the outcomes:
p argcp argv[0]p argv[1]p argv[2]p argv[3]p argv[4]- …
- Type
nandEnterto run the next line of code:size = atoi(argv[1]);- Turn into scrolling mode to observe that dreaded
Segmentation faultnotice.- Scrolling down to see if
gdbhelps identify the issue?Type
qto exitgdb.- Rerun gdb on
array_4executable as follows:$ gdb array_4 gdb-peda$ b main gdb-peda$ run 3
- The next line of code to be run is
size = atoi(argv[1]);- Run the following commands and observe the outcomes:
p argcp argv[0]p argv[1]p argv[2]- …
- Type
nandEnterto run the next line of code:size = atoi(argv[1]);- Run the following commands and observe the outcomes:
p sizep &size- Type
nandEnterto run the next line of code:printf("Before malloc, p is pointing to address (%p)\n", p);- Run the following commands and observe the outcomes:
p p
19. Hands on: finish running array-4
- Step through the
forloop and printing out values ofi,p[i],&p[i], andp + iat every iteration.- Make sure that you understand the lines of code that cause these variables to change value.
- Utilize scrolling as needed.